Axiom BB Pro
Overview
Bollinger Bands on a single timeframe tell you part of the volatility story. Add a second timeframe and the context widens. Add a third and the picture fills in. The problem is getting those readings onto one chart without juggling separate indicators — and without wondering whether the higher-timeframe data is lying about what was actually known at the time.
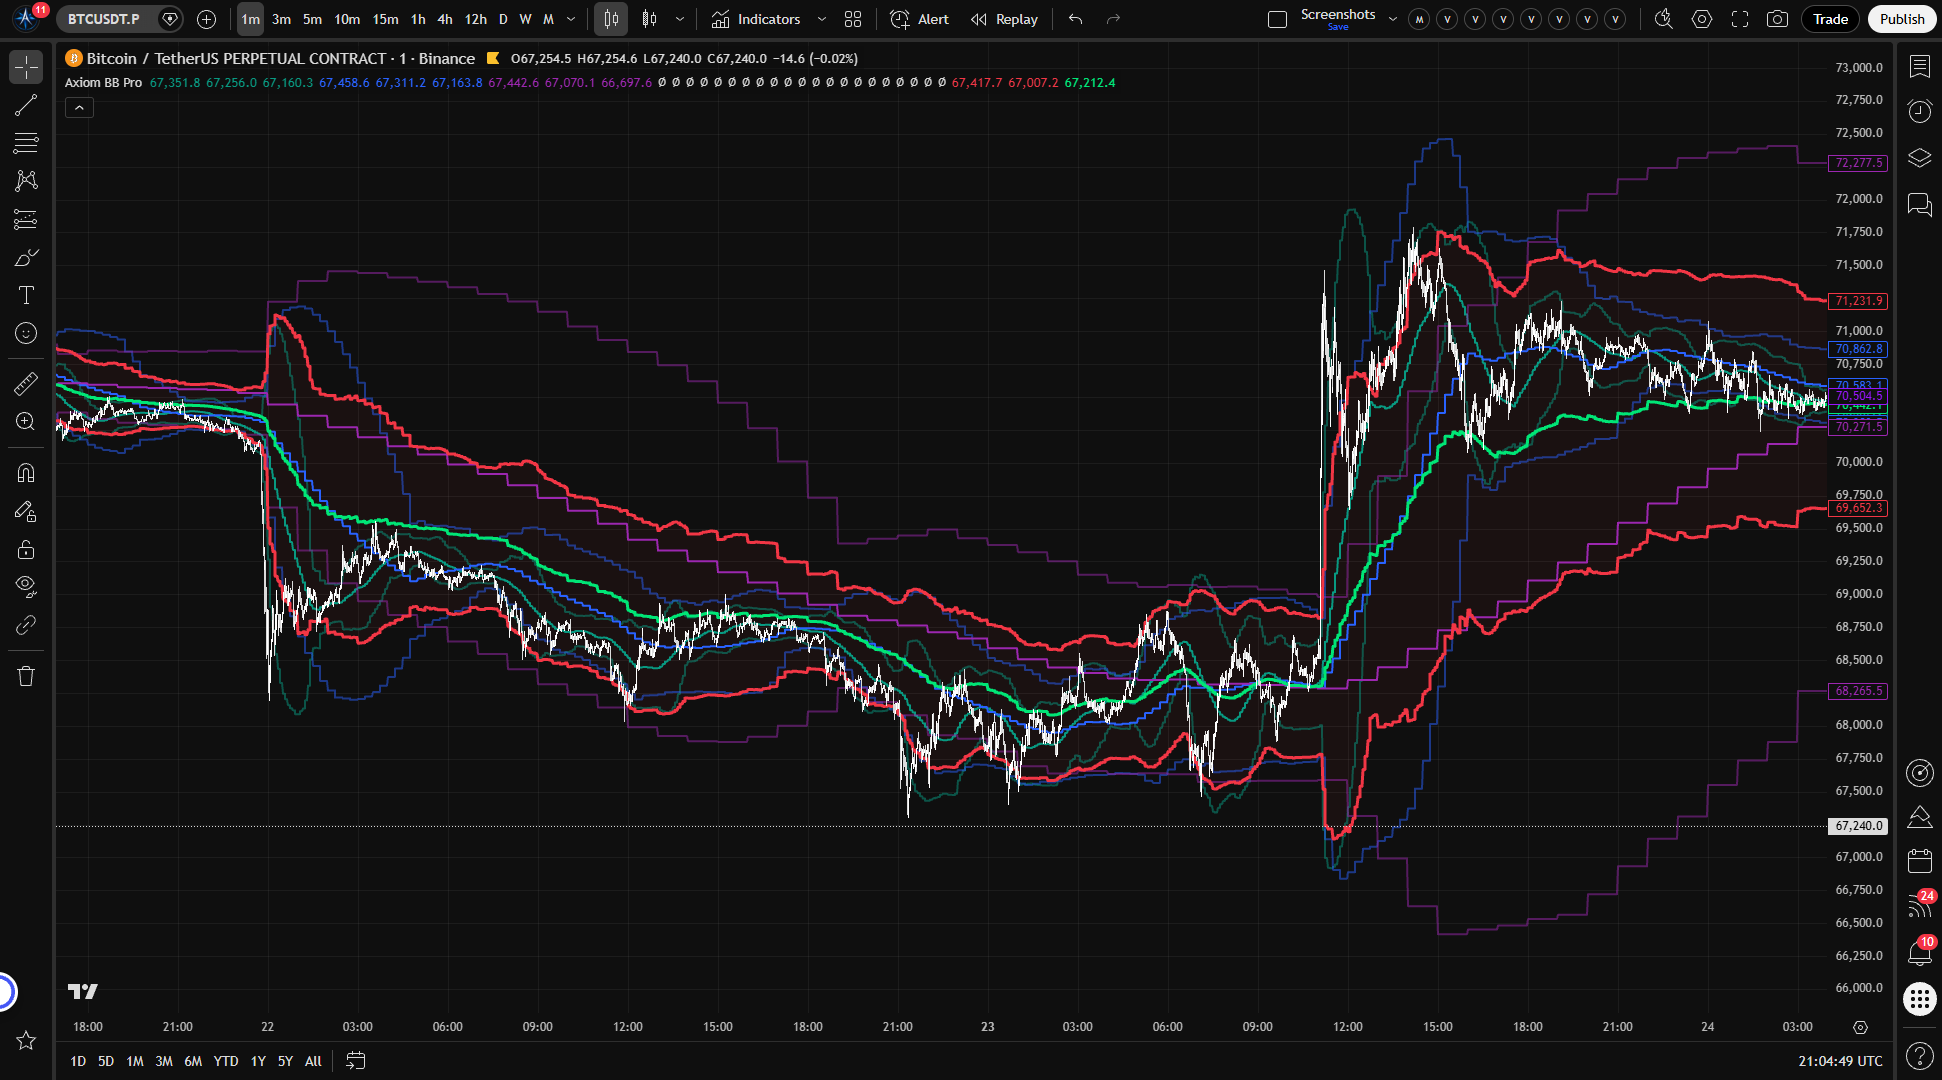
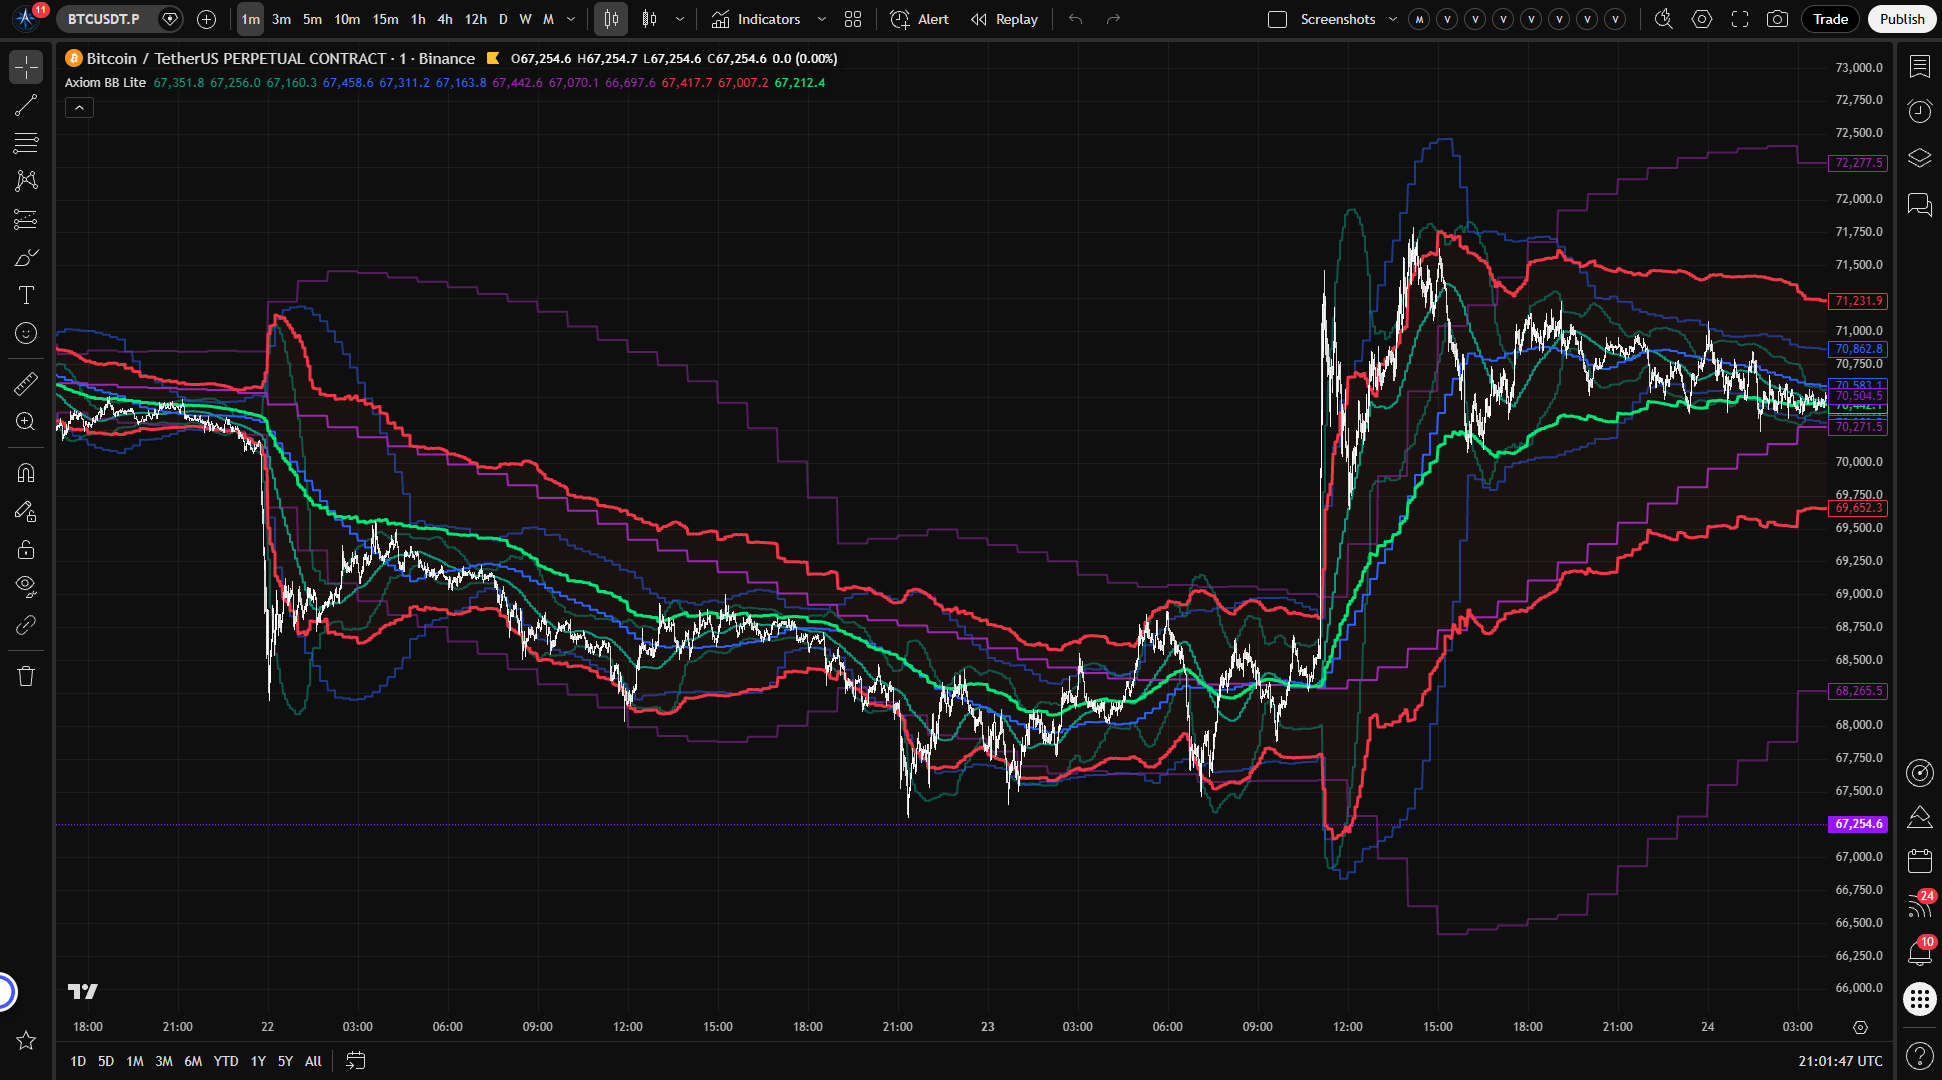
Axiom BB Pro runs up to 10 independent Bollinger Band setups on a single chart. Each slot gets its own timeframe, symbol, moving-average type, and repaint preference. An optional blended band combines enabled slots into one composite envelope using weights you control.
This is built for traders who already work with Bollinger Bands and need structural volatility context across time scales. It assumes you know what a higher-timeframe overlay is, why repainting matters, and that you are willing to spend time configuring slots to match how you actually trade.
If you are looking for a plug-and-play signal from Bollinger Bands, this is not the right tool. If you do not know what repainting means or why it should concern you, start there before coming here.
The main trust boundary: the default mode uses confirmed higher-timeframe values, so what you see on historical bars is what was known when those bars formed. That behavior is configurable per slot — faster updates at the cost of historical reliability, with the tradeoff labeled and the choice yours.
Why this matters
A 5-minute Bollinger Band captures the current session's volatility. A 60-minute band captures the broader structure. When those readings converge — or visibly diverge — that contrast is worth having. But it only means something if the higher-timeframe data reflects what was known when those bars formed, not what happened after.
Most multi-timeframe overlays compute the higher-timeframe values from chart-resolution bars and then request the result, which produces wrong standard deviation values. Or they quietly use the building candle and call it confirmed, so the historical chart looks clean but never actually looked that way while it was forming.
This indicator computes each Bollinger Band inside the higher-timeframe security context so that both the basis moving average and the standard deviation use the correct bar resolution. The default repaint setting shows only confirmed values. The result is a multi-scale volatility reading you can compare against past price action without second-guessing the data.
Features
Ten independent BB slots
Each slot runs its own Bollinger Band calculation with a separate timeframe, length, multiplier, MA type, source, and optional alternate ticker. Slots 1–3 are enabled by default at 5-minute, 15-minute, and 60-minute timeframes. Slots 4–10 are available when you need more context.
Cross-ticker support
Any slot can pull its Bollinger Band from a different symbol. The bands are scaled into the chart's price space using a ratio-based mapping so they sit at visually meaningful levels. This lets you reference structural volatility from related instruments without opening separate charts. The scaling is approximate — it works best between instruments with relatively stable price relationships.
Weighted blended band
The blend combines all active slots into a single composite upper, basis, and lower band. Each slot's contribution is controlled by an adjustable weight, normalized across enabled slots. The blend averages band outputs independently — it does not average BB parameters and recalculate. This means the blended band is a weighted composite, not a statistically independent Bollinger Band. Treat it as a summary of your multi-timeframe emphasis, not as a standalone statistical envelope.
Per-slot repaint control
Each slot has an "On Bar Close?" toggle. On (the default) means the slot uses confirmed higher-timeframe bar values — history is stable. Off means the slot reflects the building candle for faster updates, but historical values may shift after the fact. You choose the tradeoff per slot.
Multiple MA types for the basis
The basis moving average routes through the Axiom Moving Average Library. Beyond SMA, you can select ALMA, KAMA, FRAMA, Jurik, Laguerre, VAMA, and others. Each advanced type has dedicated parameters in the power-user settings that should be configured when selected.
39 alert conditions
All alerts fire on confirmed bar closes only — not on intra-bar ticks. Alerts cover per-slot regime (above/below basis, basis change), blended regime, full alignment (all active slots above or below basis), and blended band crosses.
Hidden slots still contribute to the blend
A slot with its plot hidden still feeds into the blended band calculation. Use this to reduce chart clutter while keeping a timeframe's influence in the composite.
How to use
- Add Axiom BB Pro to an intraday chart where higher-timeframe context adds value — a 1-minute or 5-minute chart is a good starting point.
- The defaults activate three slots at 5m, 15m, and 60m, all using SMA basis, length 20, StdDev multiplier 2.0, equal blend weights, and the blended band enabled.
- You should see three distinct BB envelopes — progressively wider and smoother at higher timeframes — plus a blended composite fill.
- Confirm "On Bar Close?" is ON for all three slots. With this setting, the bands step-update at each slot's timeframe boundary, not on every chart bar. On a 1-minute chart, watch a 5-minute boundary pass. The BB 01 values should update at that boundary and hold steady until the next one.
- To verify a slot's output, apply a standalone Bollinger Band to a chart at that slot's timeframe with matching length and multiplier. The values should align, accounting for the one-bar lag from confirmed mode.
Settings
Settings are organized into per-slot groups (BB 01 through BB 10), per-slot power-user groups (BB 01 PU through BB 10 PU), and a Blended group.
The structural choices
Enable / Hide Plot — Enable turns a slot's computation on. Hide Plot removes its lines from the chart but keeps it contributing to the blend. Know the distinction: a hidden slot still shapes the blended band.
Timeframe — The timeframe at which the BB is computed. Must be at or above the chart timeframe — setting it lower produces a runtime error. Defaults: Slot 01 at 5m, Slot 02 at 15m, Slot 03 at 60m. Slots 04–10 default to the chart timeframe.
On Bar Close? — The most consequential setting per slot. ON (default): the slot returns the prior confirmed bar from that slot's timeframe. History is stable, but there is inherent lag — the band updates only when the next bar in that timeframe closes. If the slot is set to the chart timeframe, ON still means a one-bar-lag confirmed view rather than the live bar. OFF: the slot reflects the building candle. Updates are faster, but the historical chart will not match what was displayed in real time. Any strategy conclusions drawn from OFF-mode history are unreliable for backtesting.
Blended Weight — Controls how much each slot contributes to the composite band. Weights are normalized across enabled non-zero-weight slots. Defaults: 33.3 each for Slots 01–03. Setting all weights to zero produces a flat blend at zero. Heavy imbalance toward one slot means that slot dominates the composite — which may be intentional, but if done by accident it defeats the multi-timeframe premise.
The BB parameters
Length — Lookback period for both the basis MA and the standard deviation. Default: 20. Shorter lengths are more reactive; longer lengths produce smoother bands. Very short values create noise; very long values flatten the bands into near-irrelevance.
StdDev Mult — Band width relative to the basis. Default: 2.0. Changing this changes the statistical meaning of "outside the band." A multiplier of 1.0 is tight; 3.0 is wide.
Type — The moving-average type for the basis, routed through the Axiom Moving Average Library. Default: SMA. Selecting an advanced type (ALMA, KAMA, FRAMA, Jurik, Laguerre, VAMA) activates additional parameters in the corresponding power-user section. Configure those parameters when switching away from SMA — the defaults may not suit your use case.
Source — The price series used for the BB calculation. Default: close. Alternatives like hl2 or hlc3 affect band width differently — change this only if you have a specific reason.
Optional Ticker — Overrides the slot's symbol. The BB is computed on the alternate ticker and scaled into the chart's price space. Works best between instruments with stable price relationships. The scaling is a per-bar ratio, not a fixed conversion factor.
Power-user parameters
Each slot has a power-user section with parameters for advanced MA types: ALMA Offset and Sigma, KAMA/FRAMA Fast and Slow periods, Jurik Phase and Power, Laguerre Alpha, and the VAMA lookback field labeled VAMA Vol Length. These only matter when the corresponding MA type is selected for that slot. Defaults are reasonable starting points, but they are not universal — adjust them for the instrument and timeframe you are working with.
Alerts
39 alert conditions total. All fire on confirmed bar close only.
Per-slot alerts (3 per slot, 30 total) — Above Basis, Below Basis, and Basis Change for each of the 10 slots. These track whether price sits above or below each slot's center line on confirmed bars.
Blended regime alerts (3) — Above Basis, Below Basis, and Basis Change for the composite band.
Alignment alerts (2) — All active slots above basis, or all active slots below basis. These fire when every enabled slot agrees on which side of the mean price sits — a consensus across your chosen timeframes.
Blended band cross alerts (4) — Price crossing above or below the blended upper band, and crossing above or below the blended basis. These mark the confirmed bar where price crosses a key composite level.
The alignment alerts help filter to moments when multiple timeframes agree on directional context. The blended cross alerts work well for notification when price reaches a composite volatility boundary. All alerts use confirmed bars, so they will not fire and then retract.
For the geeks
Three things about how this indicator works that matter if you care about what is happening under the surface.
The BB runs inside the higher-timeframe context. When the indicator requests data from a higher timeframe, the entire Bollinger Band calculation — the basis moving average and the standard deviation — runs on that timeframe's bars. It does not compute the BB on chart-resolution bars and then request the result. That distinction matters because standard deviation is resolution-dependent: a stdev computed on 1-minute bars gives a different number than the same stdev computed on 60-minute bars, even over the same time window. Many multi-timeframe indicators get this wrong. You can verify by comparing a slot's output against a standalone BB applied directly to a chart at the target timeframe. The values should match, accounting for confirmed-mode lag.
The blend averages outputs, not parameters. The blended band does not take the average of each slot's length and multiplier and compute a single BB from those combined values. It takes each slot's already-computed upper, basis, and lower values and blends them independently using your chosen weights, normalized across active slots. This preserves each timeframe's own volatility measurement in the composite. The tradeoff: the result is not a Bollinger Band in the statistical sense. It is a weighted summary — useful as a consolidated view, but not something that carries the same probability-envelope interpretation as a single BB.
Cross-ticker scaling is a price-space approximation. When a slot uses an alternate ticker, the indicator computes a ratio between the chart symbol's close and the alternate symbol's close at the higher timeframe, then multiplies the foreign BB values by that ratio. This maps the other instrument's volatility structure into the chart's price range so it reads visually. The ratio recalculates per bar — it is not a fixed conversion. The scaling holds up well between instruments that move in roughly proportional terms. Between instruments with divergent or unstable price relationships, the approximation loosens. Treat cross-ticker bands as structural reference, not precise measurement.
FAQ
Does this indicator repaint?
With "On Bar Close?" set to ON — the default for every slot — no. The indicator uses confirmed higher-timeframe values, so what you see on past bars is what was known when those bars formed. With it set to OFF, the slot reflects the building candle and historical values can change after the fact. The tradeoff is per-slot: you can run some slots confirmed and others live. Alerts always fire on confirmed bars regardless of the On Bar Close setting.
Is the blended band a real Bollinger Band?
No. A standard Bollinger Band is a single moving average plus a standard deviation envelope computed on one price series at one resolution. The blended band is a weighted average of multiple independently computed BB outputs across different timeframes and potentially different symbols. It is a composite view — useful for seeing where your multi-timeframe emphasis sits relative to price, but it does not carry the same statistical meaning as a single BB. Do not treat a blended band touch the same way you would treat a single-BB band touch.
What happens if I turn off On Bar Close?
The slot starts reflecting the building higher-timeframe candle instead of waiting for confirmation. Updates come faster, but the cost is real: scroll back on historical bars and the chart shows the final values, not the intermediate ones you saw in real time. Any visual backtesting or pattern review done in OFF mode is working with revised history. If you need historical reliability, leave On Bar Close on.
Can I hide a slot but keep it in the blend?
Yes. The "Hide Plot" toggle removes the slot's lines from the chart but does not remove it from the blended band calculation. Useful when you want a timeframe to influence the composite without adding visual weight to the chart.
Is the cross-ticker scaling the same as correlation analysis?
No. The scaling maps an alternate instrument's Bollinger Bands into the chart's price space using a per-bar close ratio. It shows you where that instrument's volatility boundaries would sit at your chart's price level. It does not measure correlation, relative strength, or cointegration. Use it as a structural reference for how another market's volatility envelope relates to yours — not as a statistical relationship measure.
Limitations
- The blended band is a weighted composite of BB outputs, not a statistically independent Bollinger Band. It does not carry the same probability-envelope properties that a single BB does.
- Cross-ticker scaling uses a per-bar price ratio. Between instruments with unstable or diverging price relationships, the scaled bands become less meaningful. It is not suited for instruments that trade at fundamentally different scales without a stable ratio.
- Turning "On Bar Close?" OFF for any slot means that slot's historical values may differ from what was shown in real time. Do not draw backtesting conclusions from OFF-mode history.
- The indicator does not generate trade signals, score setups, or rank conditions. What the bands mean for your strategy is your call.
- Setting a slot's timeframe below the chart timeframe produces a runtime error. Timeframes must be at or above the chart resolution.
- Enabling all 10 slots without a clear structural reason adds visual clutter and computation load without necessarily adding useful context.
- The blend weight system requires deliberate configuration. Default equal weighting across three slots is a reasonable starting point, but the composite changes character as you adjust. A heavily lopsided blend is effectively a single-timeframe reading with minor noise from the others.
Support and training
For setup guidance, configuration questions, or feature requests, visit the AxiomCharts website.
Disclaimer
This indicator is an educational and analytical tool. It does not constitute financial advice, trade recommendations, or guarantees of any outcome. Trading involves significant risk of loss. Past volatility patterns do not predict future price movement. You are solely responsible for your trading decisions and risk management.