indicator | Volatility / Bollinger Bands / Multi-Timeframe
Axiom BB Lite
Axiom BB Lite stacks up to three Bollinger Band slots on one chart, blends them into a weighted composite, and keeps the repaint tradeoff explicit instead of hidden. It is for traders who already use Bollinger Bands and want honest higher-timeframe context, not a plug-and-play signal machine.
Last updated: Apr 4, 2026
Crypto / Forex / Stocks / Futures / Indices | 1m / 5m / 15m / 1H / 4H / 1D
Best-fit markets
Primary timeframes
Product details
Explore the details to see whether the tool fits the problem you are trying to solve for.
Axiom BB Lite
Overview
Adding higher-timeframe Bollinger Bands to a chart raises a question most MTF scripts skip: were those band positions actually available at the time, or did they shift after the candle closed? The distinction matters for anyone who reviews setups on historical bars — if the bands moved after the fact, the review is built on ground that wasn't actually there.
Axiom BB Lite runs up to three independent Bollinger Band calculations — each on its own timeframe, with its own length, standard deviation multiplier, and MA basis type — and combines them into a single weighted composite. The default setting uses confirmed higher-timeframe data, so the bands you see on past bars match what was knowable when those bars were forming.
Who this is for: Traders who already work with Bollinger Bands and want to read volatility structure across multiple timeframe scales on one chart — without managing duplicate indicators or wondering whether the HTF overlay rewrote itself overnight.
Not for you if: You need an indicator that generates entries or exits. This tool maps volatility boundaries across timeframes. What you do with that map is your call.
Why this matters
A tight reading on a 5-minute Bollinger Band might still sit comfortably inside a 60-minute range. That kind of cross-timeframe comparison is how traders layer volatility context — but it only holds if the band positions were actually present when the candle was live. When they shift after the fact, every conclusion drawn from that view is working with evidence that wasn't really there.
Configuring three separate BB indicators at different timeframes is tedious but straightforward. The harder problem is whether the HTF data underneath is stable enough to base decisions on.
One setting on this indicator matters more than any other: "On Bar Close?" It defaults to on. That means the higher-timeframe bands use completed, confirmed values — they step once per HTF bar close and stay put. Turning it off gives faster intrabar updates, but the historical picture can change. Settings, FAQ, and Limitations all cover that tradeoff, because it shapes every other choice you make with this tool.
Features
Three independent Bollinger Band slots
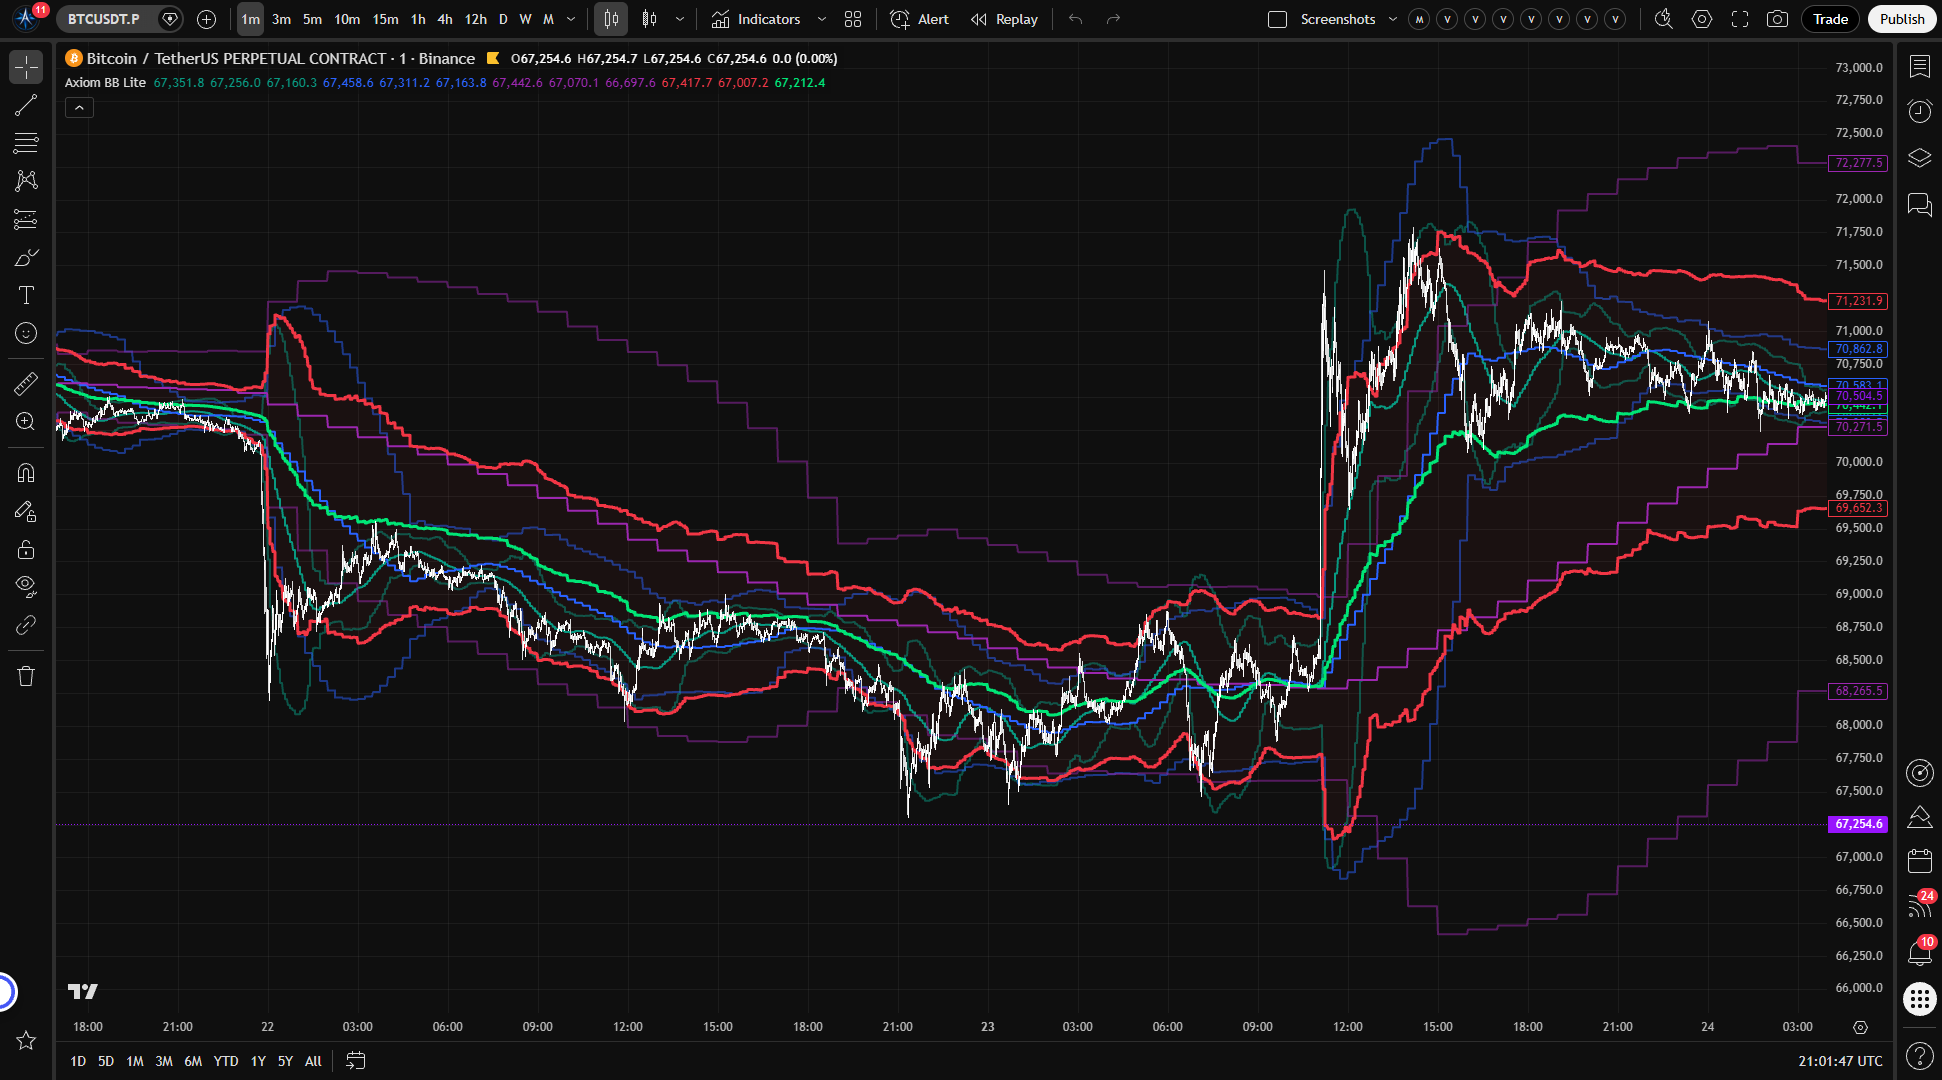
Each slot runs its own Bollinger Band calculation at its own timeframe, with its own length, standard deviation multiplier, and MA basis type. Slot 1 defaults to 5 minutes (teal), slot 2 to 15 minutes (blue), slot 3 to 60 minutes (purple). Enable, disable, or hide each one independently. A hidden slot still contributes to the blended band if it remains enabled — hiding removes the visual from the chart, not the data from the composite.
Blended Bollinger Band
When more than one slot is active, the blended band (red fill zone, lime basis line) averages them into a single composite envelope. Upper, basis, and lower are each averaged independently — the blend does not mix upper values into lower values. Each slot's influence is set by its weight. It is a summary view: per-timeframe detail traded for a single scannable shape. The blend does not add analytical information the individual slots do not already contain.
Cross-ticker support
Any slot can pull its Bollinger Band data from a different symbol. Enter a ticker in the "Optional Ticker" field and the indicator computes that symbol's BB in the higher-timeframe context, then maps the bands into your chart's price space using a ratio of closing prices. The scaled bands are proportional representations — visually meaningful on your chart, but not the alternate symbol's literal price levels. Works best between instruments that move in related ways. Illiquid tickers or mismatched trading hours can produce gaps in the ratio.
MA library routing
The basis line for each slot can use SMA, EMA, ALMA, and other moving average types supported by the Axiom MA Library. Different types carry different lag and weighting profiles, which changes how the center line responds to price movement. SMA is the default and the standard Bollinger Band convention.
Alerts
Eighteen built-in alert conditions covering per-slot basis regime, blended basis regime, multi-slot alignment, and blended band crosses. Every alert fires on confirmed bar close regardless of how "On Bar Close?" is set for the band calculations. Full inventory in the Alerts section below.
How to use
-
Add Axiom BB Lite to any chart. Default settings give you three BB slots at 5m, 15m, and 60m with "On Bar Close?" enabled.
-
Check what you see. On a 1-minute chart, you should see three sets of colored bands (teal, blue, purple) plus a red-filled blended zone with a lime basis line. In typical default use, the shorter timeframe bands react faster and the longer timeframe bands read broader, but do not treat width ordering as a hard rule on every bar.
-
Check the timeframe floor. Each slot's timeframe must be equal to or higher than the chart timeframe. If you are on a 15-minute chart, raise slot 1 above 5 minutes. The indicator enforces this with a runtime error rather than producing bad data silently.
-
Add cross-market context (optional). Enter a symbol in any slot's "Optional Ticker" field to see that instrument's volatility envelope scaled into your chart's price space. Verify the overlay by opening a standalone chart of the alternate ticker with the same BB settings — the band shapes should track even though the price levels differ.
-
Tune the blend. Adjust slot weights to shift emphasis toward specific timeframes. Set a weight to zero to keep the slot on the chart without it affecting the blended band. In normal use, keep the weights non-negative. The script accepts raw float weights and does not clamp them to percentage-style values.
What correct first use looks like: Three overlapping Bollinger envelopes at meaningfully different scales, with a red composite envelope and a lime basis tracking through the middle. If all three band sets look nearly identical, the slot timeframes are probably too close together to provide meaningful separation.
Settings
Per-slot settings (BB 01 / BB 02 / BB 03)
Each slot has an identical settings group.
Enable / Hide Plot — Enable controls whether the slot calculates and feeds into the blend. Hide Plot removes the lines from the chart but keeps the slot active in the composite. If you forget a hidden slot is enabled, it is still shaping the blended band without being visible on the chart. Disabling all three slots while the blend is on leaves the blend with nothing to average.
TimeFrame — The higher-timeframe context for the slot's Bollinger Band. Defaults are 5, 15, and 60 minutes. Must be equal to or higher than the chart timeframe — requesting lower-TF data triggers a runtime error that halts the script. This is an intentional guardrail. The indicator would rather stop than show data that does not mean what it appears to mean.
Length — Lookback period for both the MA basis and the standard deviation calculation. Shorter lengths produce tighter, more reactive bands. Longer lengths produce smoother, wider envelopes. Extremely short values (below 5) tend to react to individual bars rather than meaningful price structure.
StdDev Mult — The multiplier applied to standard deviation to set band width. Default is 2.0. Widening it (2.5, 3.0) gives broader context; narrowing it (1.5, 1.0) produces tighter channels. Extreme values on either end make the bands either indistinguishable from the basis or impractically wide.
MA Type — The moving average algorithm for the BB basis line, routed through the Axiom MA Library. SMA is the default and the standard Bollinger Band convention. Switching to EMA, ALMA, or another supported type changes how the center line weights recent data versus older data. Pick the one that matches your process, but understand how its smoothing profile compares to SMA at the same length before making the swap.
Blended Weight — This slot's raw influence input in the composite blend. Default is 33.3 for each slot. In the normal positive-weight use case, the blend normalizes active non-zero weights, so they do not need to sum to 100. Set a weight to zero to plot the slot's bands on the chart without them affecting the blend. The script does not clamp this field to positive percentage-style values, so negative or net-zero weight setups can produce non-standard blend behavior.
Optional Ticker — Overrides the chart symbol for this slot. The alternate ticker's BB is computed in the HTF context and scaled into the chart's price coordinates using a close-to-close ratio. The resulting bands are proportional projections, not the alternate instrument's actual volatility levels. Use this for cross-market context — for example, viewing SPY's volatility envelope overlaid on an AAPL chart. If the alternate ticker is illiquid or has mismatched trading hours, the close ratio can become unstable and produce gaps in the overlay.
Source — The price series the BB evaluates. Default is close. Change to hl2, ohlc4, or another composite if your methodology uses a different reference price. Switching sources across slots shifts each basis differently — be intentional about it.
Line Width — Visual thickness. Cosmetic only.
Blended BB settings
Enable Blended BB — Whether the weighted composite band calculates and plots. Turn off to view only the individual slot bands.
Hide Blended BB Plot — Hides the blended lines and fill from the chart. The blend remains available for alert conditions if enabled.
Line Width — Cosmetic.
Global settings
On Bar Close? — This is the most important setting on the indicator. When enabled (the default), all three slots return the previous HTF bar's completed values. The bands step once per HTF bar close, and historical positions are stable — what you see on a past bar was available at the time. When disabled, bands update within the building HTF candle. More responsive, but the historical picture can change once the HTF bar closes at a different level than its interim values. The tradeoff is immediacy versus reliability. The default costs you one HTF bar of lag and gives you a chart history you can review reliably. This toggle applies to all three slots simultaneously — there is no per-slot override.
ALMA Offset / ALMA Sigma / ALMA Floor Offset? — Fine-tuning parameters for the ALMA moving average type. Only relevant when a slot's MA Type is set to ALMA. If you are not using ALMA as a basis, these settings have no effect.
Alerts
All 18 alert conditions fire on confirmed bar close, independent of the "On Bar Close?" calculation setting. Alert messages include the ticker and interval.
Per-slot basis regime (9 alerts — 3 per slot)
| Alert | Fires when |
|---|---|
| BB 0X Is Above Basis | Confirmed bar closes at or above that slot's basis |
| BB 0X Is Below Basis | Confirmed bar closes below that slot's basis |
| BB 0X Basis Change | The above/below-basis state flipped from the previous bar |
Blended BB basis regime (3 alerts)
| Alert | Fires when |
|---|---|
| Blended BB Is Above Basis | Price at or above the blended basis on confirmed close |
| Blended BB Is Below Basis | Price below the blended basis on confirmed close |
| Blended BB Basis Change | The blended regime state flipped from the previous bar |
Multi-slot alignment (2 alerts)
| Alert | Fires when |
|---|---|
| All BB Slots Above Basis | Every enabled slot has price at or above its own basis |
| All BB Slots Below Basis | Every enabled slot has price below its own basis |
Blended band crosses (4 alerts)
| Alert | Fires when |
|---|---|
| Blended BB Crossed Above Upper Band | Price crosses over the blended upper band |
| Blended BB Crossed Below Lower Band | Price crosses under the blended lower band |
| Blended BB Crossed Above Basis | Price crosses over the blended basis |
| Blended BB Crossed Below Basis | Price crosses under the blended basis |
These are alertcondition() alerts. They do not support order-fill emulation or custom payloads beyond the default message strings.
For the geeks
Three things in this indicator go beyond textbook Bollinger Band behavior. None of them are complicated once you see the logic, but all three are worth understanding if you plan to rely on the output.
Cross-ticker price-space scaling. When a slot uses an alternate ticker, the raw BB values live in that symbol's price scale — overlay them directly and they would land off-screen or at meaningless levels. The indicator computes a ratio between the chart symbol's close and the alternate ticker's close, both from the same higher-timeframe context, then multiplies the foreign BB values by that ratio. The result is a proportional projection: band expansions and contractions show up at coherent levels on your chart, but the numbers are not the alternate instrument's actual price levels. The assumption is that the close-to-close ratio is a reasonable proxy for mapping between two price spaces. That holds between correlated instruments and gets less reliable when one side is illiquid or the two keep different session hours. You can check it: open a standalone chart of the alternate ticker with the same BB settings. The band shapes should correspond — squeezes and expansions lining up in time — even though the absolute levels differ.
Blended BB computation. The blend is a weighted average of all enabled slots, but it does not average each band as a single object. It averages upper with upper, basis with basis, lower with lower — each component independently. This matters because different timeframes can have different expansion profiles. A slot where the upper band is pushing wide while the lower holds relatively flat contributes that asymmetry into the blend rather than having it washed out. In the normal positive-weight use case, equal active weights contribute equally regardless of the absolute numbers entered. You can verify: enable one slot at full weight with the others disabled — the blend should exactly overlay that slot. Enable a second at equal positive weight and the blend should sit midway between the two. The script does not block negative weights, so treat subtractive weighting as off the paved road.
Confirmed-bar HTF data. "On Bar Close?" controls how the indicator bridges the gap between your chart's timeframe and the slot's higher timeframe. When it is on, the indicator waits for the HTF candle to finish before using its values. A 15-minute slot on a 1-minute chart steps every 15 bars. The tradeoff is one HTF bar of lag in exchange for stability: every band position on every past bar was actually knowable at that moment. When it is off, the bands read from the still-forming HTF candle and update with each chart bar. More responsive, but the values can shift when the HTF bar finally closes at a different level than the interim reads suggested. Scroll back through history with confirmation off and what the chart shows may not match what was visible in real time. The simplest way to see this: put the indicator on a 1-minute chart with a 5-minute slot. With "On Bar Close?" on, watch the bands step every five minutes. Turn it off and watch them move on each 1-minute bar. Toggle back to confirmed and verify the historical positions held steady.
FAQ
Does this indicator repaint? With the default "On Bar Close?" setting enabled — no. The indicator uses confirmed, completed higher-timeframe bar values. Band positions on historical bars were available at the time and will not shift on future bars. When you turn "On Bar Close?" off, values can change within the building HTF candle, and what the chart shows on past bars may not match what was actually visible in real time. You can verify this yourself: toggle the setting on a live chart and watch whether the bands step once per HTF bar close or update mid-candle. The default is the cautious choice for a reason.
Can I trust this for reviewing past setups or backtesting? Only with "On Bar Close?" enabled. When it is on, the bands on historical bars reflect confirmed data — the positions match what was available at each point in time. When it is off, the historical view includes values that may have shifted after the fact. There is no halfway state: the toggle either gives you stable history or it does not. If setup review or backtesting is part of your workflow, leave it on.
What does the blended band actually show me? A weighted average of all enabled slots' Bollinger Band values, computed independently for upper, basis, and lower. It is a summary view — a single composite envelope that consolidates the multi-timeframe picture into one scannable shape. The tradeoff is that it smooths away per-timeframe detail. The blend does not add information the individual slots do not already contain. If two timeframes are diverging, you will see the divergence more clearly in the individual slot bands than in the blend.
What happens when I enter a different ticker for a slot? The indicator computes that ticker's Bollinger Band in the higher-timeframe context, then maps the result into your chart symbol's price space using a ratio of closing prices. The scaled bands are proportional representations — they sit at meaningful levels on your chart, but they are not the alternate symbol's literal price levels. Works best between instruments that move in related ways. If the alternate ticker is illiquid or has mismatched trading hours, you may see gaps where the ratio becomes unreliable.
Why did the indicator throw an error when I changed a timeframe? Each slot's timeframe must be equal to or higher than the chart timeframe. Requesting lower-timeframe data from a higher-timeframe chart does not produce meaningful results, so the indicator halts with a runtime error instead of failing silently. Raise the slot's timeframe to match or exceed the chart timeframe and the error clears.
Limitations
- Repaints when "On Bar Close?" is off. With confirmation disabled, band values can change within the building HTF candle. Historical bars may not reflect what was visible in real time. Any setup review, pattern study, or backtest comparison done from that view is unreliable.
- Cross-ticker ratio stability. The price-space scaling assumes a reasonable close-to-close ratio between the chart symbol and the alternate ticker. Illiquid instruments, symbols with mismatched trading hours, or uncorrelated pairs can produce gaps or distorted band positions.
- Blend smooths away detail. The blended band is a weighted composite. It provides a useful center-of-gravity view, but it masks divergence between individual timeframes. When the slots disagree, the blend averages over that disagreement.
- Chart timeframe constraint. Every slot's timeframe must be equal to or higher than the chart timeframe. The indicator enforces this with a runtime error. If you switch chart timeframes, you may need to adjust slot settings to stay above the floor.
- No entry or exit signals. This tool measures volatility structure across timeframes. Band touches, crosses, and regime changes are events you can monitor and interpret within your own process, not trading signals.
- Non-standard chart types not verified. Behavior on Renko, Heikin Ashi, and other non-standard chart types has not been verified at time of publication.
Support and training
Questions, setup help, or feedback — visit the AxiomCharts website.
Disclaimer
This indicator is a technical analysis tool, not financial advice. It does not predict price direction, recommend trades, or guarantee outcomes of any kind. All trading involves risk, including the risk of loss. Past performance of any analysis method does not indicate future results. You are solely responsible for your trading decisions. Use this tool as one input in your own process — not as a substitute for independent judgment.
Free access
Read everything on this page first. Open it on TradingView only when you are clear on what it does and what it does not do.
Open in TradingViewRelated products
If this one is close but not quite right, there may be a better fit nearby for the same kind of chart work, testing need, or workflow gap.
Keep looking
If this one is close but not quite right, there may be a better fit nearby for the same kind of chart work, testing need, or workflow gap.
Find your starting pointWeighing a few options against each other?
Tell us what you are trying to accomplish and we will help you narrow it down honestly.